Colors and Emotions in Data Visualization
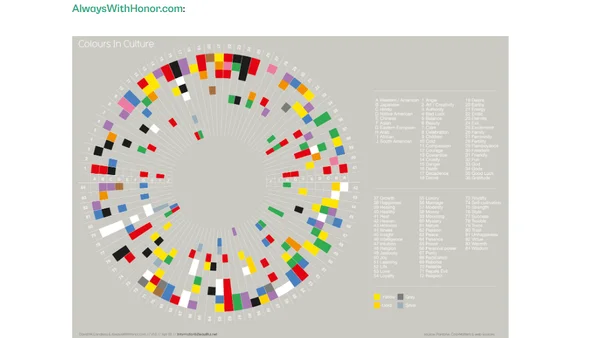
Read OriginalThis article examines the psychological impact of color in data visualization, arguing that color choices inherently trigger emotional responses in viewers. Using a case study of temperature charts for Berlin with different color palettes, it demonstrates how red (warm) and blue (cold) scales can lead to contrasting interpretations of the same data. It discusses the designer's dual role as engineer and artist, emphasizing the need to consider cultural context and viewer experience when selecting colors to convey the intended message accurately.
Comments
No comments yet
Be the first to share your thoughts!
Browser Extension
Get instant access to AllDevBlogs from your browser
Top of the Week
1
Limit token usage in Microsoft Agent Framework
Jesse Liberty
•
1 votes
2
How to Roll Back AI Agents: Incident Response, Circuit Breakers, and Recovery Patterns
Paul Bryant
•
1 votes
3
Avoiding Reasoning Model Failures with Microsoft Foundry
Luke Murray
•
1 votes
4
When Your AI Agent Lies: Silent LLM Fallbacks
Luke Murray
•
1 votes
5
Adding a custom MCP server to Claude and ChatGPT
Simon Willison
•
1 votes
6
Testing AI prompts and comparing models with promptfoo
Tim Deschryver
•
1 votes
7
Superlogical
Mitchell Hashimoto
•
1 votes