Calendar Plots With ggplot2
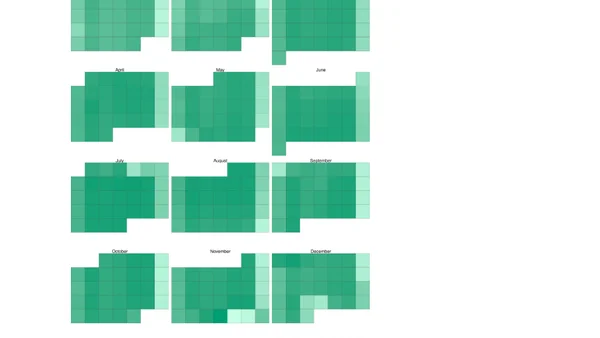
Read OriginalThis technical tutorial demonstrates how to build calendar plots with ggplot2 in R, using the nycflights13 dataset as an example. It covers data preparation, creating date labels, and generating faceted heatmap visualizations to reveal patterns like weekly periodicity in flight schedules.
0 comments
Comments
No comments yet
Be the first to share your thoughts!
Browser Extension
Get instant access to AllDevBlogs from your browser
Top of the Week
No top articles yet