Wald, score, LRT: the picture
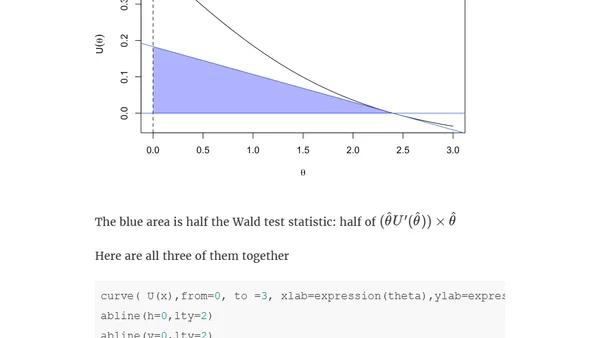
Read OriginalThis technical article provides a visual explanation of the relationship between three fundamental statistical hypothesis tests: Wald, score, and likelihood ratio tests. Using R code examples and geometric diagrams, it illustrates how these tests approximate the area under a score function curve in generalized linear models and likelihood theory, showing how they converge under local alternatives.
Comments
No comments yet
Be the first to share your thoughts!
Browser Extension
Get instant access to AllDevBlogs from your browser
Top of the Week
1
Limit token usage in Microsoft Agent Framework
Jesse Liberty
•
1 votes
2
How to Roll Back AI Agents: Incident Response, Circuit Breakers, and Recovery Patterns
Paul Bryant
•
1 votes
3
Avoiding Reasoning Model Failures with Microsoft Foundry
Luke Murray
•
1 votes
4
When Your AI Agent Lies: Silent LLM Fallbacks
Luke Murray
•
1 votes
5
Adding a custom MCP server to Claude and ChatGPT
Simon Willison
•
1 votes
6
Testing AI prompts and comparing models with promptfoo
Tim Deschryver
•
1 votes
7
Superlogical
Mitchell Hashimoto
•
1 votes