Visualizing Analytics Languages With VennEuler.jl
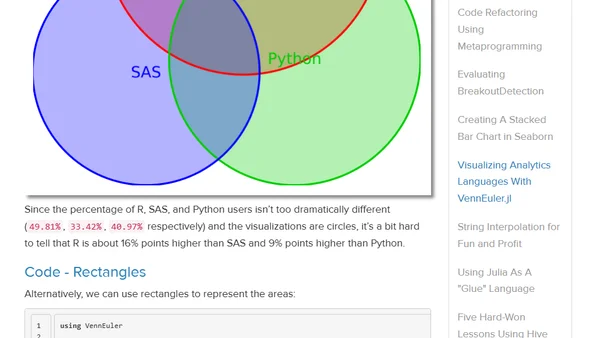
Read OriginalThis technical article details the process of recreating a data analysis software poll visualization using the VennEuler.jl package in Julia. It covers installing the package, preparing the dataset from KDNuggets survey percentages, and implementing code to generate both circle-based and rectangle-based Euler diagrams to compare the popularity of languages like R, Python, and SAS.
Comments
No comments yet
Be the first to share your thoughts!
Browser Extension
Get instant access to AllDevBlogs from your browser
Top of the Week
No top articles yet