Stack Overflow Survey 2018: Respondents World Map
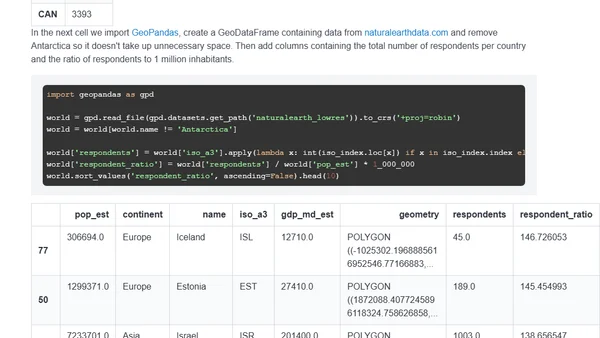
Read OriginalThis article details a data science project analyzing the Stack Overflow Developer Survey 2018. It walks through the process of loading survey data with pandas, mapping country names to ISO codes, and creating a choropleth world map using GeoPandas to visualize the number of survey respondents relative to each country's population.
Comments
No comments yet
Be the first to share your thoughts!
Browser Extension
Get instant access to AllDevBlogs from your browser
Top of the Week
No top articles yet