D3 Basics: The Linear Scale
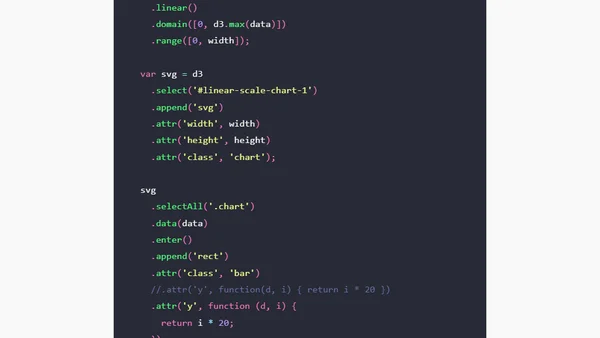
Read OriginalThis article provides a technical tutorial on implementing linear scales in D3.js. It explains how to map a continuous data domain (using a Fibonacci sequence as an example) to an output range for visualization, including code examples for creating a basic chart with SVG elements.
Comments
No comments yet
Be the first to share your thoughts!
Browser Extension
Get instant access to AllDevBlogs from your browser
Top of the Week
No top articles yet