Ryan Peek on using xts and ggplot for time-series data
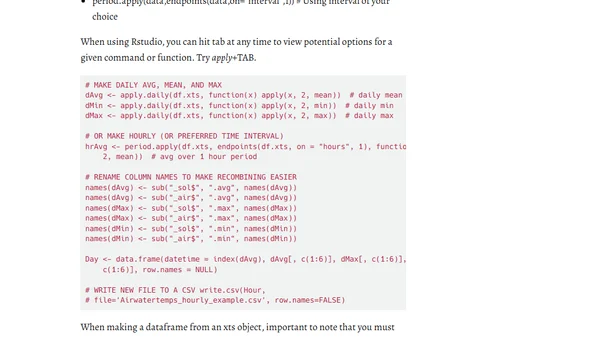
Read OriginalThis article summarizes a presentation on using the xts package in R for handling time-series data (like temperature and flow data) and the ggplot2 package for visualization. It includes a step-by-step tutorial with code examples for reading data, formatting time columns to POSIXlt, creating xts objects, and preparing data for plotting.
0 comments
Comments
No comments yet
Be the first to share your thoughts!
Browser Extension
Get instant access to AllDevBlogs from your browser
Top of the Week
No top articles yet