

Bad Weather and the Subway
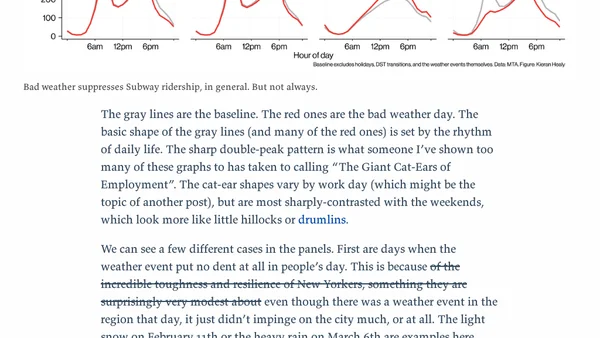
Read OriginalThis article examines New York City Subway ridership data from 2025, comparing average hourly ridership profiles for each day of the week against actual ridership on days with severe weather events. Using data from the National Weather Service, the author plots subway usage on bad weather days (shown in red) against baseline averages (in gray). Key findings include: some weather events have no effect on ridership due to New Yorker resilience; other apparent suppression is actually due to holidays like the day after Christmas; and genuine weather-related travel suppression occurs on certain snow or storm days. The analysis highlights the 'Giant Cat-Ears of Employment' pattern in weekday ridership and contrasts it with weekend profiles. This is a data-driven, tech-focused analysis using real-world datasets and visualization techniques.
Comments
No comments yet
Be the first to share your thoughts!
Browser Extension
Get instant access to AllDevBlogs from your browser
Top of the Week
No top articles yet