Using USAID data to make fancy world maps with Observable Plot
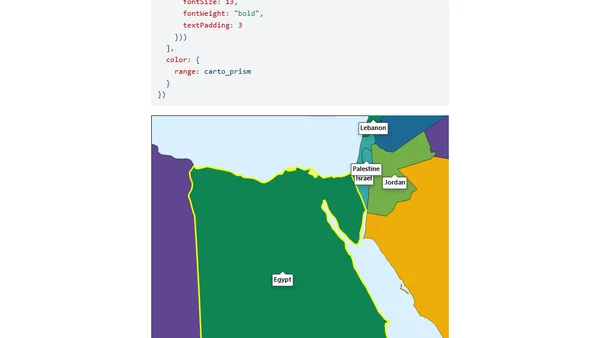
Read OriginalThis article details a technical process for visualizing USAID foreign assistance data. It covers mirroring the dataset with Datasette, manipulating geographic data, changing map projections, and creating interactive visualizations using Observable JS and Observable Plot within a Quarto document.
0 comments
Comments
No comments yet
Be the first to share your thoughts!
Browser Extension
Get instant access to AllDevBlogs from your browser
Top of the Week
No top articles yet