

Plot Math Functions With Swift Charts LinePlot
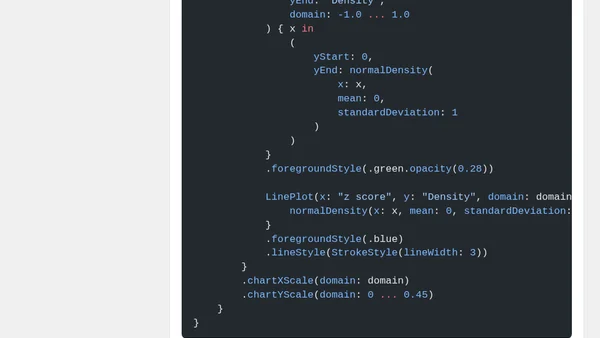
Read OriginalThis article explains how to use the new LinePlot and AreaPlot APIs introduced in Swift Charts with iOS 18 to plot mathematical functions directly, without needing to pre-sample data into an array. It covers the benefits of this approach for smooth curves like probability density functions, provides a complete code example for plotting a normal distribution, and discusses availability across Apple platforms. The article also notes the need for availability checks for older OS versions and demonstrates how to handle undefined or infinite values in function closures.
0 comments
Comments
No comments yet
Be the first to share your thoughts!
Browser Extension
Get instant access to AllDevBlogs from your browser
Top of the Week
No top articles yet