

Build A 3D Scatter Plot With Swift Charts
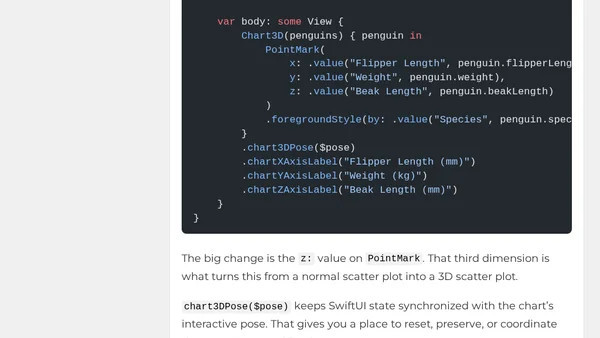
Read OriginalThis article explains how to create a 3D scatter plot using Swift Charts' new Chart3D feature, introduced at WWDC25. It covers the basics of mapping three numeric dimensions (x, y, z) to data points, using a penguin dataset with flipper length, weight, and beak length. The tutorial includes SwiftUI code examples, discusses when 3D charts are beneficial versus when 2D suffices, and mentions related features like SurfacePlot. It targets iOS 26+ and macOS 26+, making it relevant for developers working with Swift, SwiftUI, and data visualization in Apple ecosystems.
0 comments
Comments
No comments yet
Be the first to share your thoughts!
Browser Extension
Get instant access to AllDevBlogs from your browser
Top of the Week
No top articles yet