Analysing ODI performance with Flame Graphs
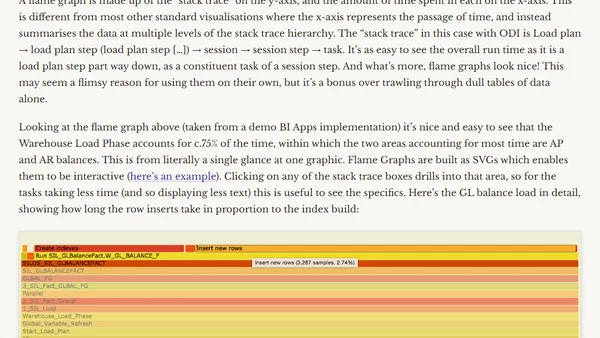
Read OriginalThis technical article explains how to apply Flame Graphs, a visualization tool popularized by Brendan Gregg, to analyze performance in Oracle Data Integrator (ODI). It details the process of generating stack traces from ODI's SNP tables to create interactive SVGs that help identify time-consuming tasks within complex load plan hierarchies, such as warehouse loads and index builds.
Comments
No comments yet
Be the first to share your thoughts!
Browser Extension
Get instant access to AllDevBlogs from your browser
Top of the Week
1
Limit token usage in Microsoft Agent Framework
Jesse Liberty
•
1 votes
2
How to Roll Back AI Agents: Incident Response, Circuit Breakers, and Recovery Patterns
Paul Bryant
•
1 votes
3
Avoiding Reasoning Model Failures with Microsoft Foundry
Luke Murray
•
1 votes
4
When Your AI Agent Lies: Silent LLM Fallbacks
Luke Murray
•
1 votes
5
Adding a custom MCP server to Claude and ChatGPT
Simon Willison
•
1 votes
6
Testing AI prompts and comparing models with promptfoo
Tim Deschryver
•
1 votes
7
Superlogical
Mitchell Hashimoto
•
1 votes