#020 Diagram cięciw (chord diagram)
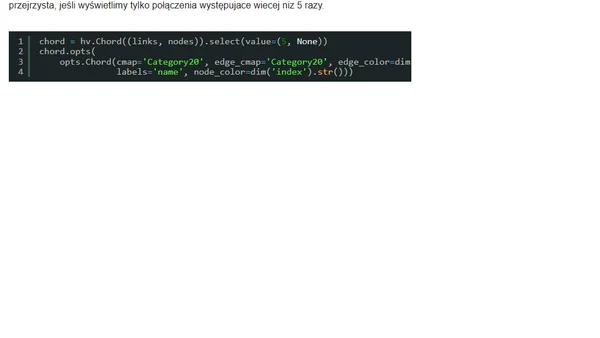
Read OriginalArtykuł wyjaśnia koncepcję diagramów cięciw (chord diagrams) - metody wizualizacji pokazującej wzajemne relacje między danymi w macierzy. Zawiera praktyczne przykłady implementacji w Pythonie przy użyciu bibliotek takich jak HoloViews, Plotapi i Plotly, demonstrując tworzenie interaktywnych wizualizacji danych z zastosowaniem tej techniki.
Comments
No comments yet
Be the first to share your thoughts!
Browser Extension
Get instant access to AllDevBlogs from your browser
Top of the Week
No top articles yet