#012 Wykres bąbelkowy (bubble chart)
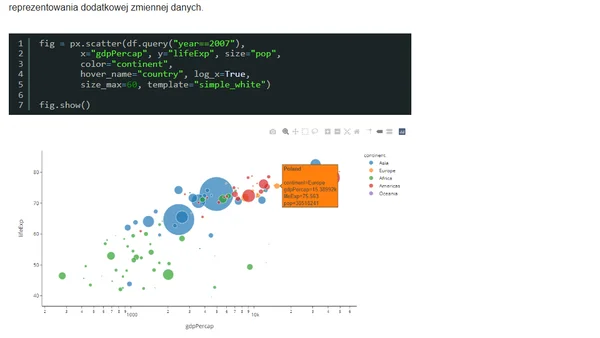
Read OriginalArtykuł szczegółowo omawia wykresy bąbelkowe (bubble charts) w Pythonie, wyjaśniając ich konstrukcję jako rozszerzenie wykresów punktowych o trzeci wymiar (rozmiar punktu). Zawiera praktyczny kod z użyciem biblioteki Plotly, pokazujący jak tworzyć podstawowe wykresy, dodawać kolory dla kategorii oraz tworzyć animacje danych w czasie na przykładzie zbioru danych Gapminder.
Comments
No comments yet
Be the first to share your thoughts!
Browser Extension
Get instant access to AllDevBlogs from your browser
Top of the Week
No top articles yet