#011 Mapa drzewa (treemap plot)
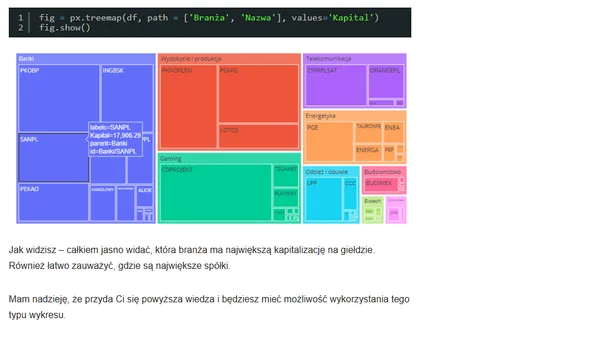
Read OriginalArtykuł wyjaśnia koncepcję wykresu mapa drzewa (treemap) - metody wizualizacji hierarchicznej struktury danych za pomocą zagnieżdżonych prostokątów. Opisuje historię, zalety i wady tej techniki oraz pokazuje praktyczny przykład tworzenia interaktywnego treemapa w Pythonie przy użyciu biblioteki Plotly do wizualizacji danych giełdowych.
Comments
No comments yet
Be the first to share your thoughts!
Browser Extension
Get instant access to AllDevBlogs from your browser
Top of the Week
1
The Beautiful Web
Jens Oliver Meiert
•
2 votes
2
Container queries are rad AF!
Chris Ferdinandi
•
2 votes
3
Wagon’s algorithm in Python
John D. Cook
•
1 votes
4
An example conversation with Claude Code
Dumm Zeuch
•
1 votes
5
Top picks — 2026 January
Paweł Grzybek
•
1 votes
6
In Praise of –dry-run
Henrik Warne
•
1 votes
7
Deep Learning is Powerful Because It Makes Hard Things Easy - Reflections 10 Years On
Ferenc Huszár
•
1 votes
8
Vibe coding your first iOS app
William Denniss
•
1 votes
9
AGI, ASI, A*I – Do we have all we need to get there?
John D. Cook
•
1 votes
10
How to Add a Quick Interactive Map to your Website
Miguel Grinberg
•
1 votes