Debugging WASM in Chrome DevTools
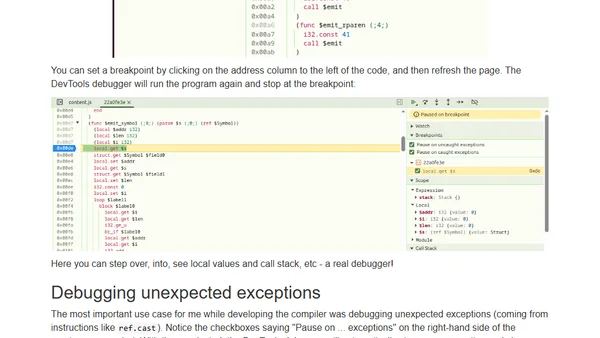
Read OriginalThis article provides a practical guide to debugging WebAssembly (WASM) code in Chrome DevTools, using a Scheme compiler backend as an example. It covers setting up a local HTTP server, loading WASM modules, using breakpoints, stepping through code, inspecting local values and call stacks, and debugging unexpected exceptions with 'Pause on exceptions' feature. The author demonstrates with a sample project that constructs and prints Scheme-like s-expressions using WASM GC references.
Comments
No comments yet
Be the first to share your thoughts!
Browser Extension
Get instant access to AllDevBlogs from your browser
Top of the Week
No top articles yet