Statistieken voetbalwedstrijd visualiseren (Python & Matplotlib)
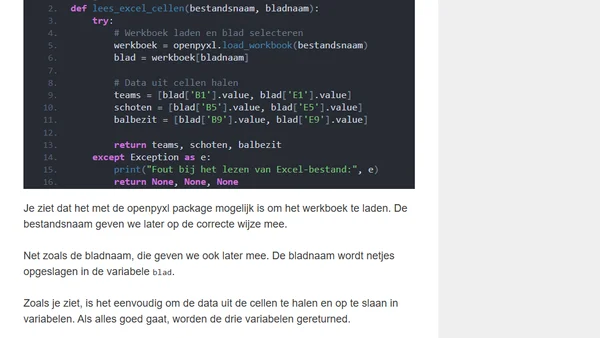
Read OriginalDit artikel is een technische tutorial die uitlegt hoe je statistieken van een voetbalwedstrijd (zoals schoten en balbezit) kunt visualiseren met Python en de bibliotheken Matplotlib en openpyxl. Het bevat een stapsgewijze handleiding voor het lezen van data uit een Excel-bestand en het maken van staaf- en taartdiagrammen in PyCharm.
Comments
No comments yet
Be the first to share your thoughts!
Browser Extension
Get instant access to AllDevBlogs from your browser
Top of the Week
No top articles yet