Roll your own memory profiling: it's actually not hard
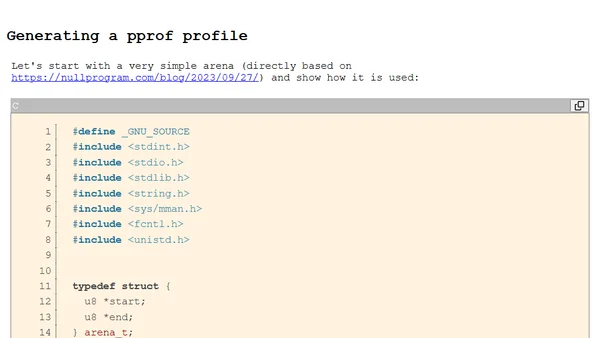
Read OriginalThis technical article explains how to create a simple, dependency-free memory profiler in C using the pprof text format. It covers tracking allocations, call stacks, memory usage, leaks, and generating flamegraphs, specifically when using a custom allocator like an arena allocator.
0 comments
Comments
No comments yet
Be the first to share your thoughts!
Browser Extension
Get instant access to AllDevBlogs from your browser
Top of the Week
No top articles yet