

Removing Chart Gridlines and Plot Area Background in Report Studio
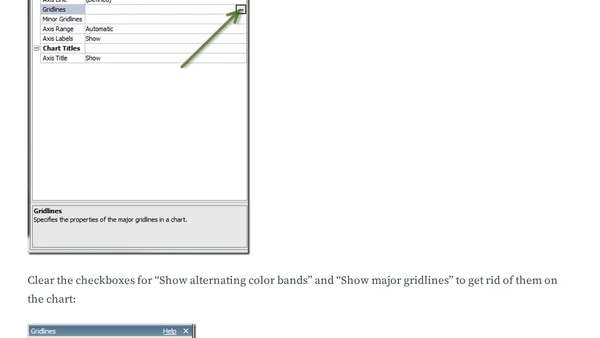
Read OriginalThis article provides a step-by-step guide for removing gridlines and alternating color bands from charts in IBM Report Studio. The author shares their frustration with official documentation and explains the common pitfall of clicking the axis label instead of the axis itself. By selecting the correct element, users can access the Gridlines property in the property inspector and clear the checkboxes for 'Show alternating color bands' and 'Show major gridlines'. The article is aimed at IT professionals working with reporting tools and data visualization, offering a practical solution to a common UI issue.
Comments
No comments yet
Be the first to share your thoughts!
Browser Extension
Get instant access to AllDevBlogs from your browser
Top of the Week
No top articles yet